The Boston Matrix, also known as the Boston Consulting Group (BCG) Matrix, is a tool used in strategic management to evaluate the relative market share and growth potential of a company's product lines or business units. It is a graphical representation of a company's portfolio of products or businesses, with the purpose of helping the company allocate resources and prioritize its efforts.
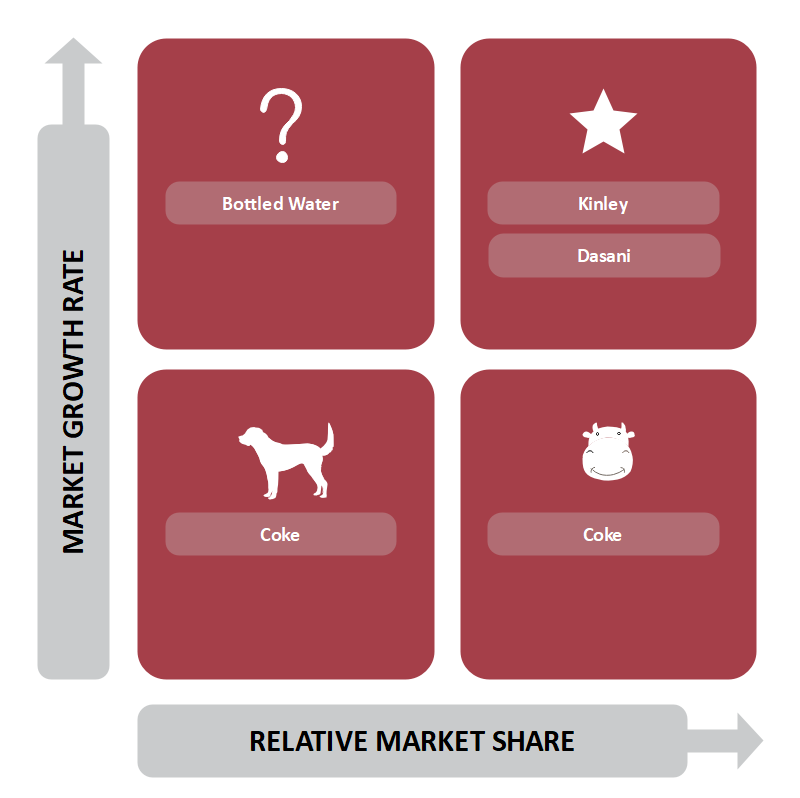
The matrix is divided into four quadrants, based on the combination of market growth rate and market share. The quadrants are labeled as follows:
Stars: These are products or business units that have a high market share in a rapidly growing market. They require significant resources to maintain their position, but have the potential for high profitability.
Cash cows: These are products or business units with a high market share in a mature or slow-growing market. They generate a steady stream of cash flow, but have limited potential for growth.
Dogs: These are products or business units with a low market share in a mature or slow-growing market. They consume resources without generating significant revenue or growth.
Question marks: These are products or business units with a low market share in a rapidly growing market. They have the potential to become stars, but also have a high risk of failure.
A company's portfolio of products or business units should ideally include a mix of stars, cash cows, and question marks, with minimal investment in dogs. The goal is to convert question marks into stars, while maintaining and maximizing the cash flow from cash cows.
One example of a company using the Boston Matrix is Procter & Gamble (P&G), a consumer goods manufacturer. P&G has a diverse portfolio of products, including well-known brands such as Crest toothpaste, Tide laundry detergent, and Pampers diapers. Using the Boston Matrix, P&G can evaluate the relative performance of each of these product lines and allocate resources accordingly.
For example, Crest toothpaste may be classified as a cash cow, with a high market share in a mature market. P&G may therefore focus on maintaining Crest's market share and maximizing its profitability, rather than investing heavily in marketing and new product development. On the other hand, P&G may classify a new product, such as a plant-based cleaning solution, as a question mark, with low market share in a rapidly growing market. P&G may then invest more resources in marketing and product development for this product, with the hope of turning it into a star.
While the Boston Matrix is a useful tool for strategic management, it has its limitations. It is based on assumptions about market growth and market share, which may not always be accurate. It also does not take into account other factors that may influence a product's success, such as competition, changing consumer preferences, and technological advances. Additionally, the matrix does not provide a clear plan for how to move products from one quadrant to another.
Overall, the Boston Matrix is a valuable tool for evaluating the relative performance and potential of a company's product lines or business units. By considering market growth and market share, companies can prioritize their efforts and allocate resources effectively, with the aim of maximizing profitability and long-term success.
:max_bytes(150000):strip_icc()/GettyImages-1138644649-55b5854805eb44649063271113413de8.jpg)